Data & Analytics
Menu
We often assume that seniority and experience lead naturally to more fulfilment at work. You might think your veteran employees have it all figured out. However, our latest research shows a more complicated picture…
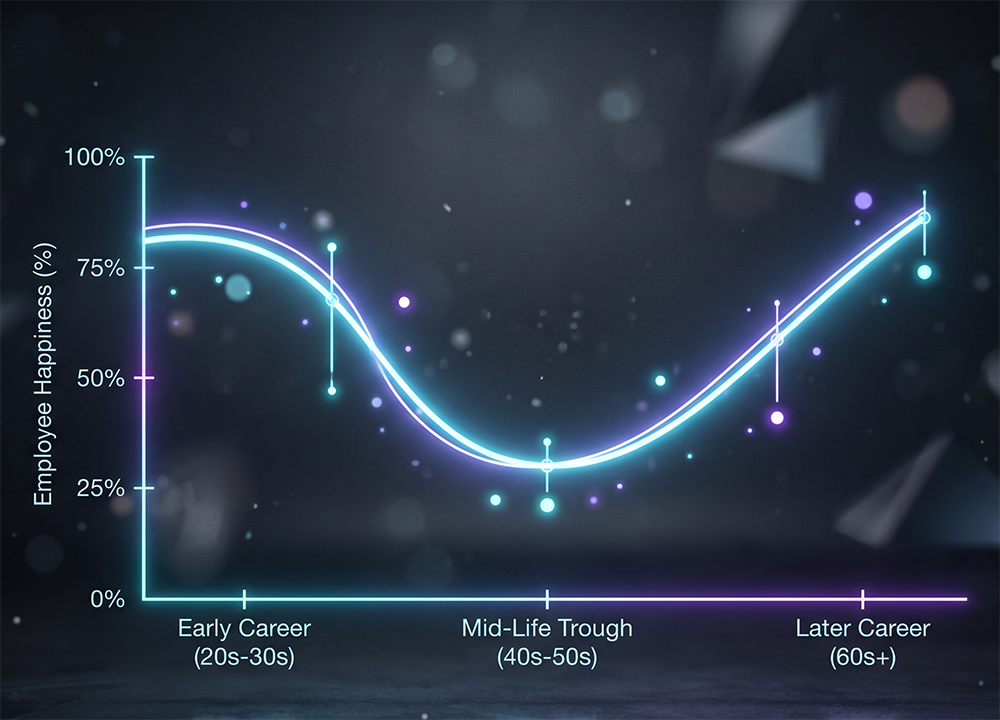
The Global Workplace Happiness Report 2026 analysed 1.9 million individual data points and nearly 90,000 written comments from over 80,000 working people across 115 countries. The data highlights a distinct U-shaped curve in workplace safety and relationship satisfaction.
Happiness scores typically climb as we get older. But this upward arc is interrupted by a sharp trough in our middle working years.
Your employees aged 50 to 59 currently report the lowest scores for relationship satisfaction and organisational trust. This group is often at the peak of their professional capability. Yet they are also the most likely to find workplace relationships draining.
This generation faces unique pressures. They often manage younger teams while simultaneously caring for children and ageing parents. This creates a high emotional tax. For example, a senior manager might struggle to stay energised in back-to-back strategy meetings while worrying about a family health crisis at home.
The data shows a particularly worrying trend in feedback. Frequency-of-feedback scores decline steadily until they hit their lowest point for those between 50 and 59. Organisations often stop investing in these workers because they seem self-sufficient. For example, a director with 20 years of experience might never receive a formal “well done” because leadership assumes they already know their value.
This lack of feedback contributes to a loyalty-without-advocacy pattern. Meaning, these employees plan to stay, but they are the least likely to recommend you to others.
Re-engaging this group offers a massive business benefit. They hold the most institutional knowledge. You can unlock this by pairing them with younger workers through circular mentorship. This serves both groups. The younger worker gets guidance. The older worker gets a fresh burst of relational energy. Win-win!
Now you’re armed with the data, let’s revisit that opening question: Are you taking your most experienced people for granted?
Download The Global Workplace Happiness Report 2026 >
Many leaders use the report to understand trends about workplace culture from similar organisations. However, the real value comes from applying those insights to your specific data and context. If you’re interested, we also have:
Custom, board-level reports, which offer tailored benchmarks for any vertical or demographic, using our 1.9 million data points.
Or we can connect you with a Culture Consultant to review your practices and discuss how we can use data, business expertise and AI to help you convert your culture into performance.
Related articles

Get in touch for a quick chat with one of our experts to see how we can help you.

Take our benchmark to map where your organisation is now, and where it needs to be.